Glacier atlas. Numbers you can touch.
An interactive data journey from 1850 to today as a use case for the data service. How scientific numbers become a tangible narrative.
Glacier atlas. Numbers you can touch.
An interactive data journey from 1850 to today as a use case for the data service. How scientific numbers become a tangible narrative.
Data that answers as soon as you ask.
What this service is
Data as a service: numbers you can touch. Comparisons instead of abstract values, scales instead of percentages, a reading journey instead of a table.
This subpage shows the anatomy of such data communication using the Swiss glacier atlas 1850 to 2025. The data basis is robust, measured, curated. The atlas is a sketch of how a research institution or a climate organisation could bring these numbers to life.
Time scrubber
Drag live through 175 years
Comparisons
Bern HB instead of 3.3 km
Correlation
Ice follows temperature, visible
Citable
GLAMOS citation copy-ready
Where it fits, where it does not
- long-term data series with a clear trend
- subjects with spatial and temporal depth
- research results that should reach the public
- organisations with their own dataset or connection to open sources
- operational dashboards with update frequencies under an hour
- datasets without a tellable arc
- predefined messages that data should illustrate
- playful data visualisation without substance
The starting point
A Swiss research institution has been measuring the mass balance of Swiss glaciers for over a century. The data is clean, the annual reports excellent, the specialist audience informed. The broader public hears headlines.
What if the story of the ice existed as an interactive data journey. With a slider through nearly two centuries. With comparisons that translate abstract volumes into tangible images. With a stripe visualisation of the climate trend that speaks without words.
What follows is that atlas as a sketch.
Six acts, one century
This is how the glacier atlas could be built. Each act one step deeper into the data, each act with GLAMOS sources.
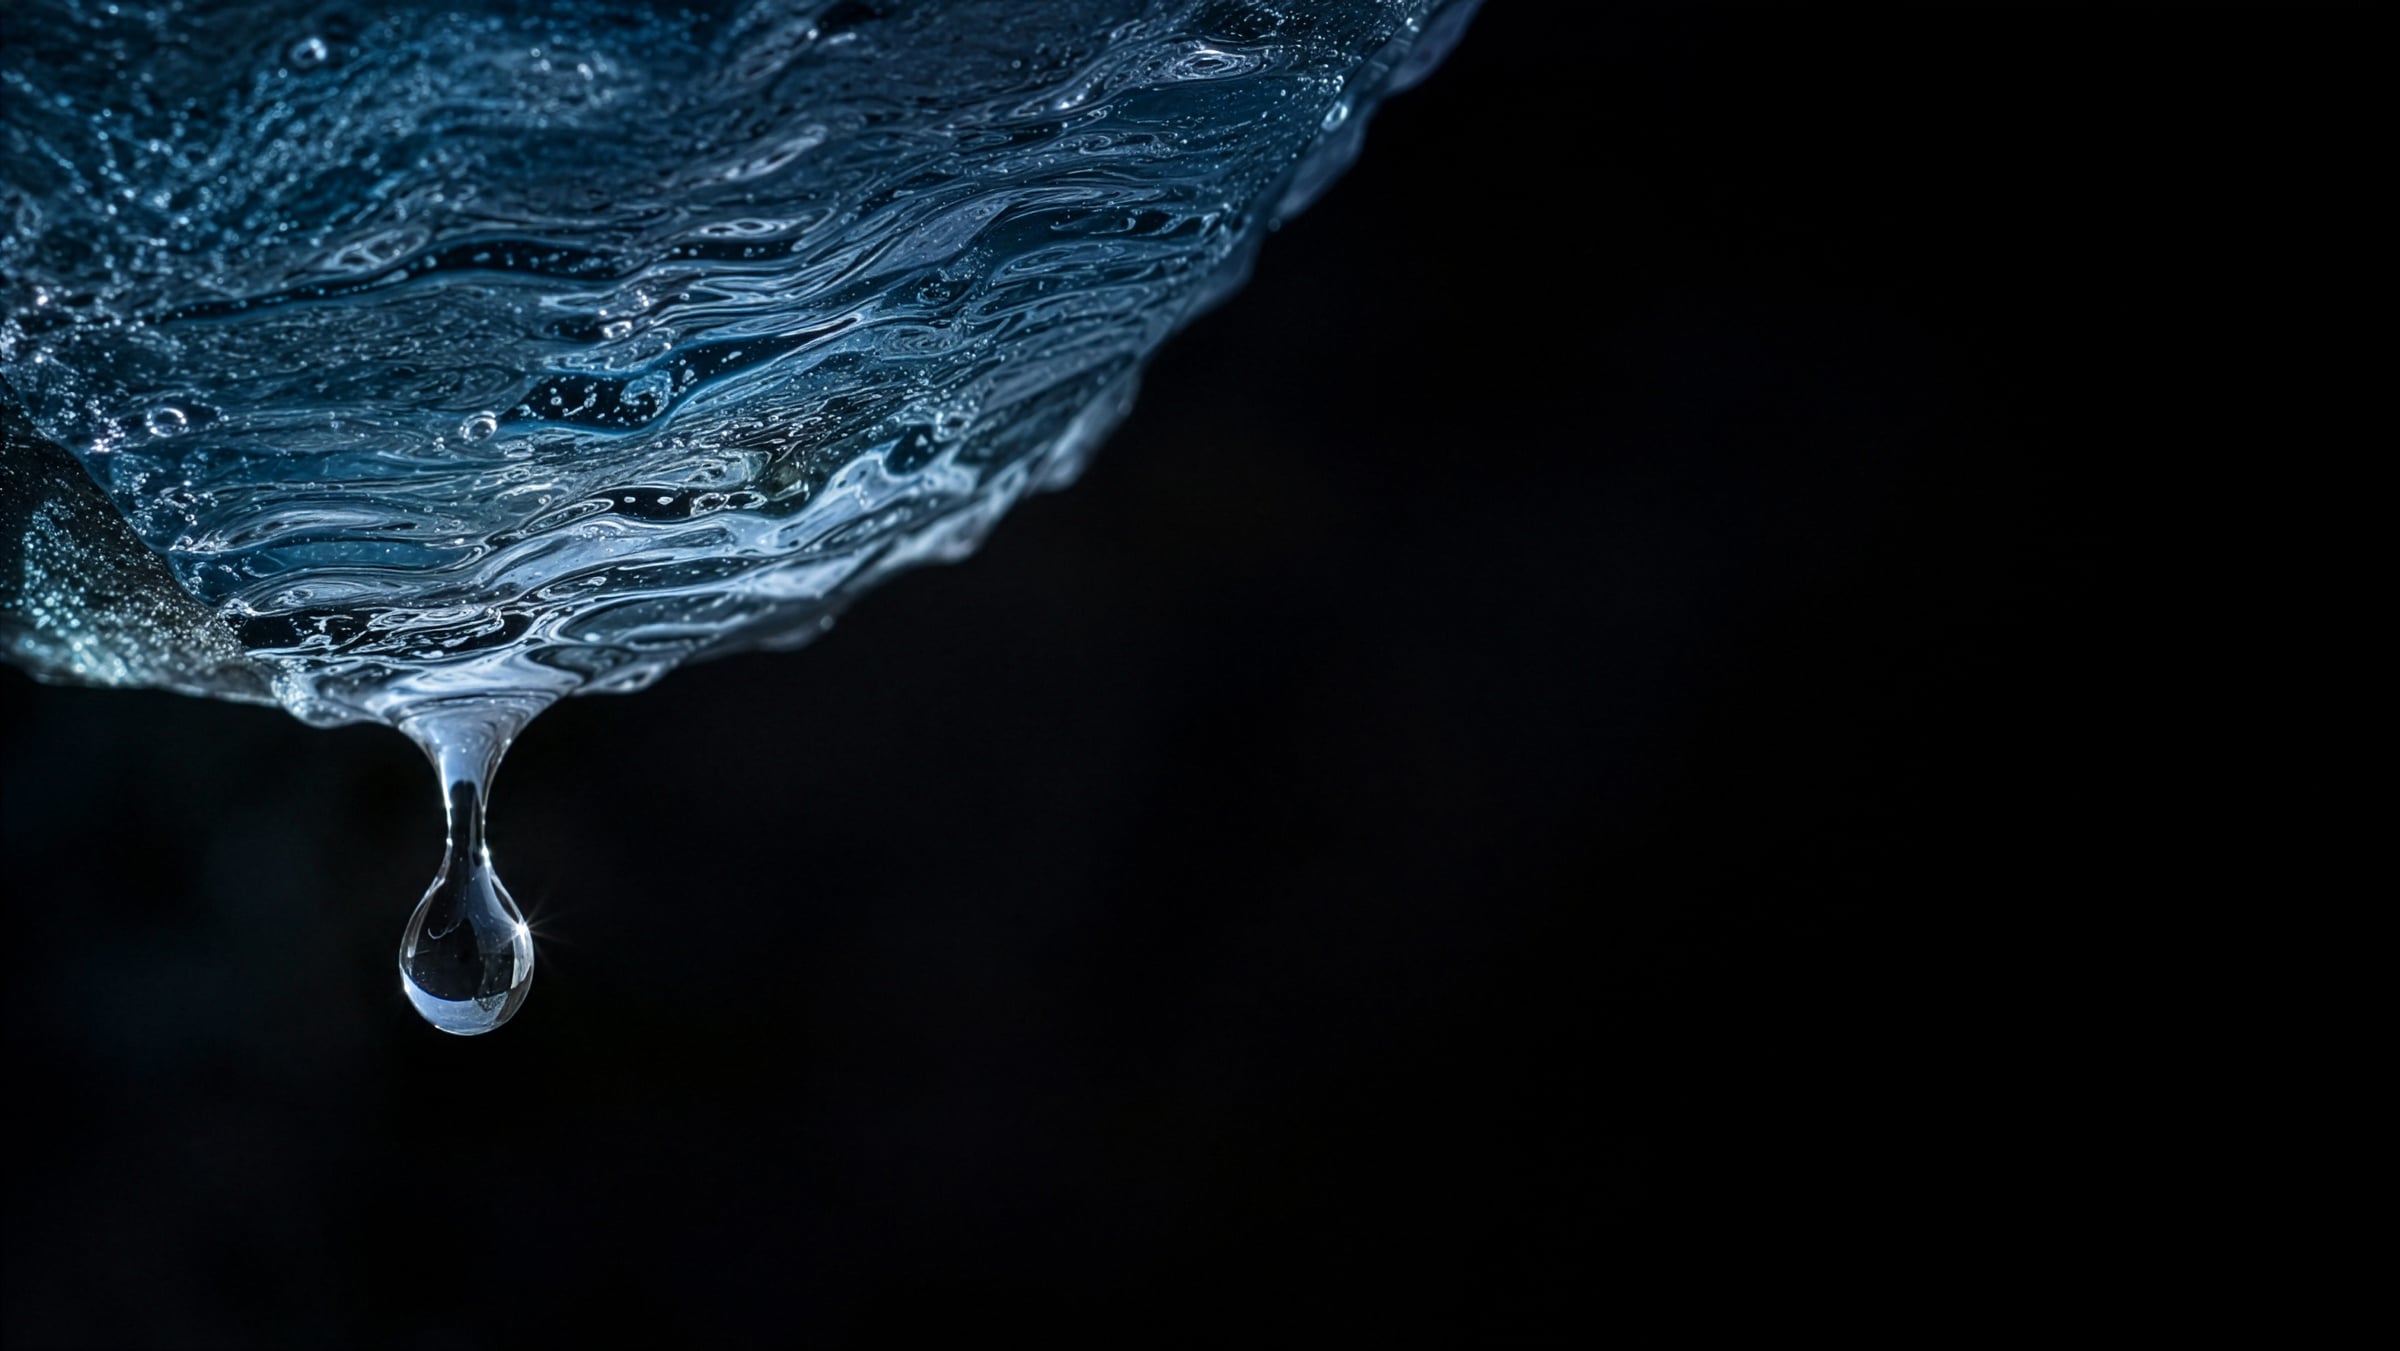
Encounter
A drop, a second. High summer on the glacier: the ice works audibly. What is happening here in the Swiss heights began with industrialisation, climate gas, albedo, a long chain of observable physics. What Switzerland has lost since 1850 is not abstract. It is measurable, in cubic kilometres and metres of ice thickness. Drag through the years.
The volume curve
Switzerland has been measuring its glaciers since the end of the Little Ice Age. The volume series is one of the longest documented worldwide. It shows a decline that is accelerating. Run the cursor through the curve and read the values directly.
Since 2015 alone, Switzerland has lost a quarter of its glacier volume. These are not the losses of a century. These are the losses of a decade.
Volume estimate after GLAMOS annual report 2024/25. 1973 as reference (100 %). Data points 1850 and 1900 modelled from historical maps and photogrammetry.
Aletsch in comparison
The Grosser Aletschgletscher is the best-known glacier in Switzerland. It is 22.6 km long today. Since 1870 it has lost 3.3 km in length, 1.5 km of that in the last 40 years. Below the Konkordiaplatz, the ice thickness has decreased by over a hundred metres.
Three point three kilometres are not tangible. Three point three kilometres are the distance from Bern central station to the Natural History Museum, there and back. This distance has transformed from ice into scree and pioneer vegetation.
Length and area data after SAC, RAOnline and GLAMOS mass balance. The schematic map shows only the tongue down to the former terminus.
length lost 1870 → 2025
Bern central station to the Natural History Museum and back.
retreat over the last four decades
About one schoolyard length, every single year.
ice thickness lost at Konkordiaplatz
A thirty-storey tower, downward from Konkordiaplatz.
The acceleration
Each hydrological year stripe shows the annual mass balance. Blue when the glacier gains mass. Red when it loses. The last fifteen years are deep red.
2022 and 2023 are unprecedented. In those two years alone, Switzerland lost about 15% of its total glacier volume. 2024/25 continues this trend, the fourth-largest loss since measurements began.
Both series turn deep red over the last fifteen years. Ice follows temperature.
Mass balance stripes after GLAMOS annual reports 2010 to 2025. Values in metres water equivalent across the entire glacier area.
Temperature anomaly against reference period 1961 to 1990 after MeteoSwiss. Swiss warming since measurements began in 1864 is around 3 °C, roughly twice as fast as global average.
A surprising finding
Between the 2016 and 2023 inventories, 159 glaciers have completely disappeared from Switzerland. That corresponds to 11% of all registered glaciers. The list grows year by year.
These glaciers had names, stories, cantons. A selection, located on the Swiss map:
Hover or tap an entry to see the site on the map.
Selection from the Swiss glacier inventory (ETH and WSL). The full list contains 159 glaciers.
What is happening
GLAMOS measures, documents, publishes every year. MeteoSwiss contextualises. ETH and WSL research the physical fundamentals, permafrost and hazard patterns. Glacier protection in the narrow sense, with fleece covers on individual tongues, is a symbolic, not an effective contribution in the bigger picture.
What I contribute here as a data service: an atlas that arranges the volume curve, the stripes, the vanished names so that they stay. No shock images. Reference anchors instead of percentages. Sources that lie open. If at the end someone can compare 1923 with today without first having to google a number, the atlas has done its work.
Direct citation
GLAMOS (2025). Swiss Glacier Inventory 2025.
ETH Zurich and WSL, doi:10.18752/glamos-2025.
How I would build it
Four phases, in this order, with clear handovers.
Understand
Conversations with the data source (GLAMOS, MeteoSwiss, WSL). Which series are robust, which modelled, which live-update capable? Which comparison anchors work for the audience?
Concept
Define the data journey: number of acts, pace, depth. Which data as chart, which as map, which as stripe. Which comparison anchors (city sizes, distances, volume translations).
Build
Editorial text, data connection, SVG visualisations, slider logic. Performance: annual data points and stripes must be readable immediately, also on mobile devices.
Polish
Scientific peer-read by the data source, editorial final pass, source check, updates workflow defined.
Scientific foundation
All data and statements on this page are based on the following sources.
- GLAMOS — Annual mass balance of Swiss glaciers 2024/2025 (PDF)
- GLAMOS — Swiss Glacier Bulletin 2025 (PDF)
- GLAMOS — Annual mass balance 2023/2024 (PDF)
- ETH/WSL — And Swiss glaciers continue to melt
- MeteoSwiss — Glaciers continue to melt
- SRF — Swiss glacier retreat 2025
- SAC — Grosser Aletschgletscher
- Naturwissenschaften.ch — Aletsch mass balance
- Gletschervergleiche.ch — Aletsch before/after
- RAOnline — Aletsch 1850 to 2022
Climate sparkline in the lab
A climate time series as a sparkline. Sister visualisation to the large glacier volume curve, different dataset, same logic.
Data to tell?
If you are working on a dataset that deserves more than a PDF with diagrams, get in touch. First conversation, no strings attached.